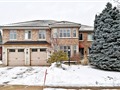
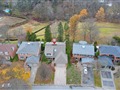
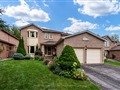
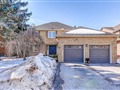
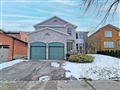
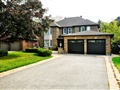
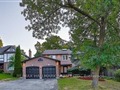
71 Seaton Dr
$1,007,658
Comparative Market Analysis
Jun 23, 2025
NOT AN ACTIVE LISTING
Historical Performance
| Period | $ Change | % Change |
| 1 Day | +$290 | +0.029% |
| 7 Days | +$237 | +0.024% |
| 30 Days | -$1,571 | -0.156% |
| 3 Months | -$2,383 | -0.236% |
| 6 Months | +$17.6k | +1.78% |
| 1 Year | -$44.3k | -4.21% |
| 3 Years | +$184k | +22.3% |
| 5 Years | +$292k | +40.8% |
| 10 Years | +$592k | +142% |
List My Property
Real Estate Statistics
Financing Solutions
Browsing History
19 Cousins Dr, Aurora
1 second ago
AS SEEN ON


Are You a Licensed Real Estate Agent or Broker?