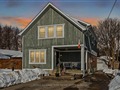
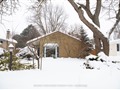
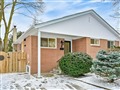
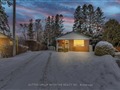
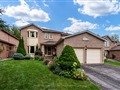
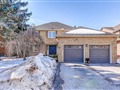
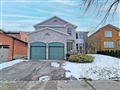
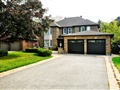
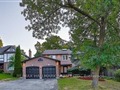
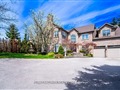
69 Child Dr
$1,442,991
Comparative Market Analysis
Jun 23, 2025
NOT AN ACTIVE LISTING
Historical Performance
| Period | $ Change | % Change |
| 1 Day | +$416 | +0.029% |
| 7 Days | +$363 | +0.025% |
| 30 Days | -$2,142 | -0.148% |
| 3 Months | -$3,091 | -0.214% |
| 6 Months | +$25.8k | +1.82% |
| 1 Year | -$62.5k | -4.15% |
| 3 Years | +$263k | +22.3% |
| 5 Years | +$415k | +40.3% |
| 10 Years | +$852k | +144% |
List My Property
Real Estate Statistics
Financing Solutions
Browsing History
5 Huron Crt, Aurora
1 second ago
44 Devins Dr, Aurora
1 second ago
AS SEEN ON


Are You a Licensed Real Estate Agent or Broker?