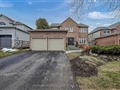
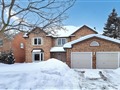
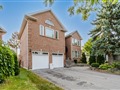
68 Child Dr
$1,237,092
Comparative Market Analysis
Mar 4, 2025
NOT AN ACTIVE LISTING
Historical Performance
| Period | $ Change | % Change |
| 1 Day | +$356 | +0.029% |
| 7 Days | +$147 | +0.012% |
| 30 Days | -$2,634 | -0.212% |
| 3 Months | -$5,201 | -0.419% |
| 6 Months | +$17.0k | +1.39% |
| 1 Year | -$60.0k | -4.63% |
| 3 Years | +$284k | +29.8% |
| 5 Years | +$460k | +59.2% |
| 10 Years | +$599k | +93.7% |
List My Property
Real Estate Statistics
Financing Solutions
AS SEEN ON


Are You a Licensed Real Estate Agent or Broker?