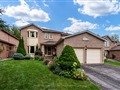
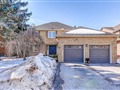
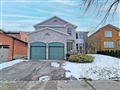
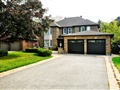
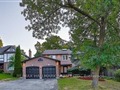
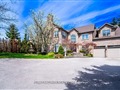
67 Seaton Dr
$1,176,358
Comparative Market Analysis
Jun 23, 2025
NOT AN ACTIVE LISTING
Historical Performance
| Period | $ Change | % Change |
| 1 Day | +$339 | +0.029% |
| 7 Days | +$240 | +0.020% |
| 30 Days | -$2,015 | -0.171% |
| 3 Months | -$3,379 | -0.286% |
| 6 Months | +$19.3k | +1.67% |
| 1 Year | -$54.8k | -4.45% |
| 3 Years | +$204k | +20.9% |
| 5 Years | +$319k | +37.2% |
| 10 Years | +$663k | +129% |
List My Property
Real Estate Statistics
Financing Solutions
Browsing History
32 Attridge Dr, Aurora
0 second ago
72 Attridge Dr, Aurora
1 second ago
26 Moorcrest Dr, Aurora
1 second ago
22 Moorcrest Dr, Aurora
1 second ago
6 Moorcrest Dr, Aurora
1 second ago
AS SEEN ON


Are You a Licensed Real Estate Agent or Broker?