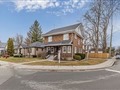
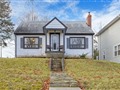
67 Closs Sq
$1,337,767
Comparative Market Analysis
Jun 4, 2025
NOT AN ACTIVE LISTING
Historical Performance
| Period | $ Change | % Change |
| 1 Day | +$392 | +0.029% |
| 7 Days | +$349 | +0.026% |
| 30 Days | -$1,979 | -0.148% |
| 3 Months | -$2,916 | -0.217% |
| 6 Months | +$23.8k | +1.81% |
| 1 Year | -$57.6k | -4.13% |
| 3 Years | +$274k | +25.8% |
| 5 Years | +$430k | +47.4% |
| 10 Years | +$814k | +155% |
List My Property
Real Estate Statistics
Financing Solutions
Browsing History
18 Keystone Crt, Aurora
1 second ago
374 John West Way, Aurora
1 second ago
116 Kidd Circ, Aurora
2 seconds ago
341 John West Way, Aurora
2 seconds ago
56 Valhalla Crt, Aurora
2 seconds ago
263 John West Way, Aurora
2 seconds ago
261 John West Way, Aurora
3 seconds ago
AS SEEN ON


Are You a Licensed Real Estate Agent or Broker?