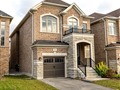
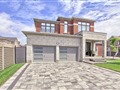
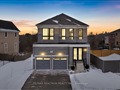
66 Gilbank Dr
$1,465,054
Comparative Market Analysis
Jun 23, 2025
NOT AN ACTIVE LISTING
Historical Performance
| Period | $ Change | % Change |
| 1 Day | +$352 | +0.024% |
| 7 Days | -$58 | -0.004% |
| 30 Days | -$3,577 | -0.244% |
| 3 Months | -$6,477 | -0.440% |
| 6 Months | +$20.5k | +1.42% |
| 1 Year | -$77.7k | -5.04% |
| 3 Years | +$203k | +16.1% |
| 5 Years | +$248k | +20.3% |
| 10 Years | +$701k | +91.8% |
List My Property
Real Estate Statistics
Financing Solutions
Browsing History
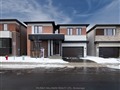
78 Buttonwood Tr, Aurora
6 seconds ago
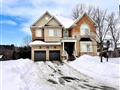
84 Cranberry Lane, Aurora
11 seconds ago
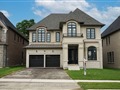
162 Deerglen Terr, Aurora
16 seconds ago
230 Deerglen Terr, Aurora
21 seconds ago
44 Trillium Dr, Aurora
26 seconds ago
20 Cosford St, Aurora
31 seconds ago
64 Hill Dr, Aurora
36 seconds ago
62 Whispering Pine Tr, Aurora
41 seconds ago
27 Wellington Heights Crt, Aurora
46 seconds ago
92 Pine Hill Cres, Aurora
50 seconds ago
AS SEEN ON


Are You a Licensed Real Estate Agent or Broker?