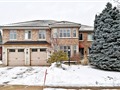
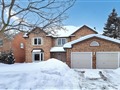
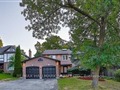
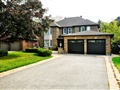
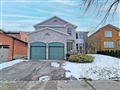
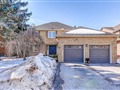
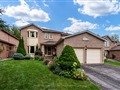
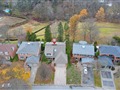
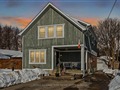
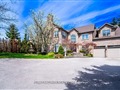
6 Windham Tr
$2,350,606
Comparative Market Analysis
Jun 23, 2025
NOT AN ACTIVE LISTING
Historical Performance
| Period | $ Change | % Change |
| 1 Day | +$677 | +0.029% |
| 7 Days | +$1,153 | +0.049% |
| 30 Days | -$677 | -0.029% |
| 3 Months | +$4,552 | +0.194% |
| 6 Months | +$63.2k | +2.76% |
| 1 Year | -$47.0k | -1.96% |
| 3 Years | +$640k | +37.4% |
| 5 Years | +$986k | +72.3% |
| 10 Years | +$1.49m | +174% |
List My Property
Real Estate Statistics
Financing Solutions
Browsing History
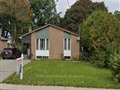
8 Teasdale Crt, Aurora
1 second ago
150 Dawlish Ave, Aurora
1 second ago
AS SEEN ON


Are You a Licensed Real Estate Agent or Broker?