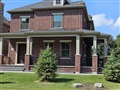
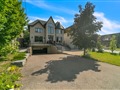
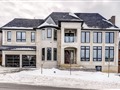
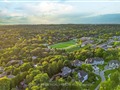
59 Closs Sq
$1,388,767
Comparative Market Analysis
Jun 4, 2025
NOT AN ACTIVE LISTING
Historical Performance
| Period | $ Change | % Change |
| 1 Day | +$407 | +0.029% |
| 7 Days | +$187 | +0.013% |
| 30 Days | -$2,914 | -0.209% |
| 3 Months | -$5,809 | -0.417% |
| 6 Months | +$19.0k | +1.39% |
| 1 Year | -$73.0k | -4.99% |
| 3 Years | +$266k | +23.6% |
| 5 Years | +$432k | +45.2% |
| 10 Years | +$859k | +162% |
List My Property
Real Estate Statistics
Financing Solutions
Browsing History
All Properties in Bayview Southeast, Aurora
1 second ago
43 Closs Sq, Aurora
1 second ago
10 Beau Crt, Aurora
1 second ago
149 John West Way, Aurora
2 seconds ago
19 Durblee Ave, Aurora
2 seconds ago
10 Birch Crt, Aurora
2 seconds ago
127 Major Cres, Aurora
2 seconds ago
76 Closs Sq, Aurora
2 seconds ago
12 Ransom St, Aurora
3 seconds ago
366 John West Way, Aurora
3 seconds ago
AS SEEN ON

Are You a Licensed Real Estate Agent or Broker?