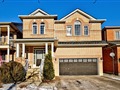
59 Billingham Hts
$1,202,864
Comparative Market Analysis
Jul 1, 2025
NOT AN ACTIVE LISTING
Historical Performance
| Period | $ Change | % Change |
| 1 Day | +$354 | +0.029% |
| 7 Days | +$473 | +0.039% |
| 30 Days | -$972 | -0.081% |
| 3 Months | +$318 | +0.026% |
| 6 Months | +$28.5k | +2.43% |
| 1 Year | -$31.4k | -2.54% |
| 3 Years | +$291k | +32.0% |
| 5 Years | +$382k | +46.6% |
| 10 Years | +$601k | +99.9% |
List My Property
Real Estate Statistics
Financing Solutions
Browsing History
87 October Lane, Aurora
5 seconds ago
AS SEEN ON


Are You a Licensed Real Estate Agent or Broker?