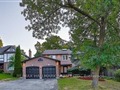
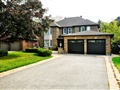
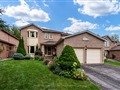
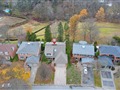
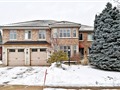
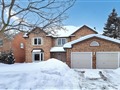
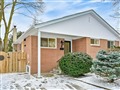
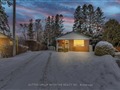
58 Seaton Dr
$3,373,748
Comparative Market Analysis
Jun 23, 2025
NOT AN ACTIVE LISTING
Historical Performance
| Period | $ Change | % Change |
| 1 Day | +$972 | +0.029% |
| 7 Days | +$401 | +0.012% |
| 30 Days | -$7,184 | -0.212% |
| 3 Months | -$14.2k | -0.419% |
| 6 Months | +$46.2k | +1.39% |
| 1 Year | -$177k | -5.00% |
| 3 Years | +$526k | +18.5% |
| 5 Years | +$1.34m | +65.8% |
| 10 Years | +$2.75m | +439% |
List My Property
Real Estate Statistics
Financing Solutions
Browsing History
34 Seaton Dr, Aurora
6 seconds ago
99 Walton Dr, Aurora
11 seconds ago
AS SEEN ON


Are You a Licensed Real Estate Agent or Broker?