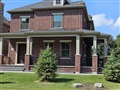
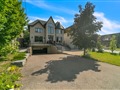
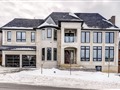
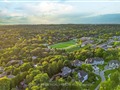
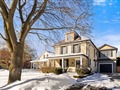
58 Closs Sq
$1,365,385
Comparative Market Analysis
Jun 4, 2025
NOT AN ACTIVE LISTING
Historical Performance
| Period | $ Change | % Change |
| 1 Day | +$400 | +0.029% |
| 7 Days | +$1,091 | +0.080% |
| 30 Days | +$2,517 | +0.185% |
| 3 Months | +$19.2k | +1.43% |
| 6 Months | +$72.7k | +5.62% |
| 1 Year | -$2,070 | -0.151% |
| 3 Years | +$344k | +33.7% |
| 5 Years | +$513k | +60.1% |
| 10 Years | +$833k | +156% |
List My Property
Real Estate Statistics
Financing Solutions
Browsing History
10 Avondale Cres, Aurora
1 second ago
135 Zokol Dr, Aurora
1 second ago
32 Wells St, Aurora
1 second ago
118 Stonecliffe Cres, Aurora
2 seconds ago
27 Perivale Gdns, Aurora
2 seconds ago
9 Highland Crt, Aurora
3 seconds ago
48 Stonecliffe Cres, Aurora
3 seconds ago
69 Hollandview Tr, Aurora
3 seconds ago
9 Beau Crt, Aurora
3 seconds ago
72 Rothwell St, Aurora
3 seconds ago
AS SEEN ON


Are You a Licensed Real Estate Agent or Broker?