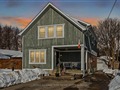
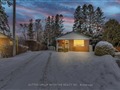
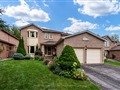
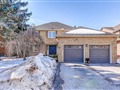
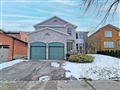
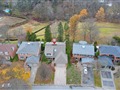
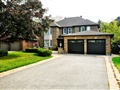
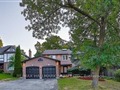
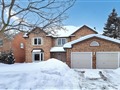
48 Child Dr
$1,574,364
Comparative Market Analysis
Jun 23, 2025
NOT AN ACTIVE LISTING
Historical Performance
| Period | $ Change | % Change |
| 1 Day | +$454 | +0.029% |
| 7 Days | +$248 | +0.016% |
| 30 Days | -$3,051 | -0.193% |
| 3 Months | -$5,626 | -0.356% |
| 6 Months | +$23.7k | +1.53% |
| 1 Year | -$77.7k | -4.70% |
| 3 Years | +$263k | +20.1% |
| 5 Years | +$409k | +35.1% |
| 10 Years | +$833k | +112% |
List My Property
Real Estate Statistics
Financing Solutions
Browsing History
110 Brookview Dr, Aurora
2 seconds ago
16 Banff Dr, Aurora
3 seconds ago
16 Harmon Ave, Aurora
4 seconds ago
18 Mcdonald Dr, Aurora
5 seconds ago
131 Dawlish Ave, Aurora
5 seconds ago
AS SEEN ON

Are You a Licensed Real Estate Agent or Broker?