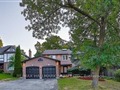
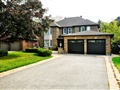
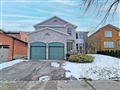
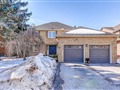
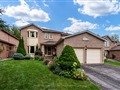
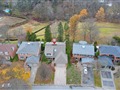
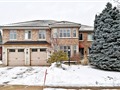
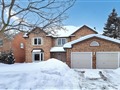
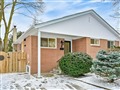
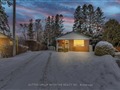
42 Child Dr
$3,051,846
Comparative Market Analysis
Jun 23, 2025
NOT AN ACTIVE LISTING
Historical Performance
| Period | $ Change | % Change |
| 1 Day | +$879 | +0.029% |
| 7 Days | +$363 | +0.012% |
| 30 Days | -$6,498 | -0.212% |
| 3 Months | -$12.8k | -0.419% |
| 6 Months | +$41.8k | +1.39% |
| 1 Year | -$160k | -5.00% |
| 3 Years | +$515k | +20.3% |
| 5 Years | +$1.43m | +88.2% |
| 10 Years | +$2.39m | +360% |
List My Property
Real Estate Statistics
Financing Solutions
Browsing History
60 Delayne Dr, Aurora
2 seconds ago
5 Willis Dr, Aurora
3 seconds ago
123 Lewis Honey Dr, Aurora
5 seconds ago
87 Weslock Cres, Aurora
6 seconds ago
Timberlane Blvd, Aurora
7 seconds ago
55 Aurora Heights Dr, Aurora
8 seconds ago
27 Bailey Cres, Aurora
9 seconds ago
6 Allenvale Dr, Aurora
10 seconds ago
11 Hammond Dr, Aurora
11 seconds ago
50 Poplar Cres, Aurora
12 seconds ago
AS SEEN ON


Are You a Licensed Real Estate Agent or Broker?