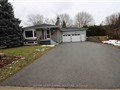
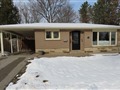
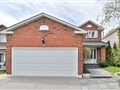
41 Child Dr
$1,399,518
Comparative Market Analysis
Jun 23, 2025
NOT AN ACTIVE LISTING
Historical Performance
| Period | $ Change | % Change |
| 1 Day | +$400 | +0.029% |
| 7 Days | +$677 | +0.048% |
| 30 Days | -$421 | -0.030% |
| 3 Months | +$2,671 | +0.191% |
| 6 Months | +$37.5k | +2.75% |
| 1 Year | -$28.7k | -2.01% |
| 3 Years | +$394k | +39.1% |
| 5 Years | +$627k | +81.2% |
| 10 Years | +$950k | +212% |
List My Property
Real Estate Statistics
Financing Solutions
Browsing History
11 Lewis Honey Dr, Aurora
2 seconds ago
47 Timpson Dr, Aurora
3 seconds ago
219 Bilbrough St, Aurora
4 seconds ago
22 Underhill Cres, Aurora
5 seconds ago
43 Chiswick Cres, Aurora
6 seconds ago
8 Lee Gate, Aurora
7 seconds ago
4 Kemano Rd, Aurora
8 seconds ago
74 Chiswick Cres, Aurora
9 seconds ago
49 Tecumseh Dr, Aurora
10 seconds ago
68 Halldorson Ave, Aurora
11 seconds ago
AS SEEN ON


Are You a Licensed Real Estate Agent or Broker?