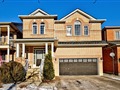
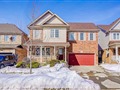
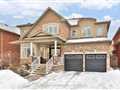
38 Billingham Hts
$1,250,776
Comparative Market Analysis
Jul 1, 2025
NOT AN ACTIVE LISTING
Historical Performance
| Period | $ Change | % Change |
| 1 Day | +$368 | +0.029% |
| 7 Days | +$202 | +0.016% |
| 30 Days | -$2,473 | -0.197% |
| 3 Months | -$4,744 | -0.378% |
| 6 Months | +$18.1k | +1.47% |
| 1 Year | -$63.1k | -4.80% |
| 3 Years | +$211k | +20.3% |
| 5 Years | +$326k | +35.3% |
| 10 Years | +$597k | +91.3% |
List My Property
Real Estate Statistics
Financing Solutions
AS SEEN ON


Are You a Licensed Real Estate Agent or Broker?