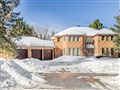
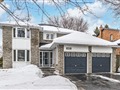
36 Lanewood Dr
$1,980,091
Comparative Market Analysis
Jun 6, 2025
NOT AN ACTIVE LISTING
Historical Performance
| Period | $ Change | % Change |
| 1 Day | +$517 | +0.026% |
| 7 Days | +$237 | +0.012% |
| 30 Days | -$3,696 | -0.186% |
| 3 Months | -$5,797 | -0.292% |
| 6 Months | +$33.0k | +1.70% |
| 1 Year | -$92.1k | -4.45% |
| 3 Years | +$316k | +19.0% |
| 5 Years | +$538k | +37.3% |
| 10 Years | +$1.16m | +143% |
List My Property
Real Estate Statistics
Financing Solutions
Browsing History
236 Pinnacle Tr, Aurora
2 seconds ago
93 Willow Farm Lane, Aurora
3 seconds ago
23 Long Valley Rd, Aurora
7 seconds ago
93 Primeau Dr, Aurora
7 seconds ago
AS SEEN ON


Are You a Licensed Real Estate Agent or Broker?