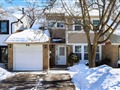
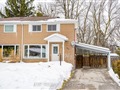
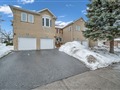
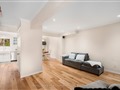
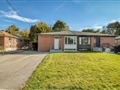
33 Richardson Dr
$910,438
Comparative Market Analysis
Jun 23, 2025
NOT AN ACTIVE LISTING
Historical Performance
| Period | $ Change | % Change |
| 1 Day | +$451 | +0.050% |
| 7 Days | +$986 | +0.108% |
| 30 Days | -$1,130 | -0.124% |
| 3 Months | -$3,611 | -0.395% |
| 6 Months | +$12.7k | +1.41% |
| 1 Year | -$43.8k | -4.59% |
| 3 Years | +$134k | +17.2% |
| 5 Years | +$241k | +35.9% |
| 10 Years | +$507k | +126% |
List My Property
Real Estate Statistics
Financing Solutions
Browsing History
123 Cranberry Lane, Aurora
2 seconds ago
27 Cranberry Lane, Aurora
3 seconds ago
9 Corbett Cres, Aurora
5 seconds ago
21 Trillium Dr, Aurora
5 seconds ago
AS SEEN ON


Are You a Licensed Real Estate Agent or Broker?