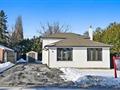
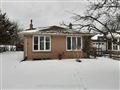
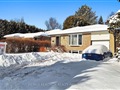
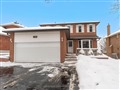
23 Gilbank Dr
$1,177,214
Comparative Market Analysis
Jun 23, 2025
NOT AN ACTIVE LISTING
Historical Performance
| Period | $ Change | % Change |
| 1 Day | +$336 | +0.029% |
| 7 Days | +$184 | +0.016% |
| 30 Days | -$2,258 | -0.191% |
| 3 Months | -$4,049 | -0.343% |
| 6 Months | +$18.2k | +1.57% |
| 1 Year | -$56.6k | -4.59% |
| 3 Years | +$216k | +22.5% |
| 5 Years | +$340k | +40.6% |
| 10 Years | +$670k | +132% |
List My Property
Real Estate Statistics
Financing Solutions
Browsing History
35 Beatty Cres, Aurora
6 seconds ago
46 Milliken Dr, Aurora
12 seconds ago
94 Henderson Dr, Aurora
17 seconds ago
Championship Circle Pl, Aurora
22 seconds ago
50 Gilbank Dr, Aurora
27 seconds ago
91 Hammond Dr, Aurora
32 seconds ago
57 Glass Dr, Aurora
42 seconds ago
87 Deerhorn Cres, Aurora
47 seconds ago
71 Gilbank Dr, Aurora
52 seconds ago
Benville Cres, Aurora
57 seconds ago
AS SEEN ON


Are You a Licensed Real Estate Agent or Broker?