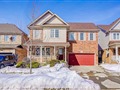
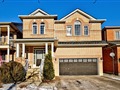
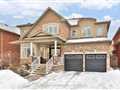
23 Ballymore Dr
$1,293,559
Comparative Market Analysis
Jun 6, 2025
NOT AN ACTIVE LISTING
Historical Performance
| Period | $ Change | % Change |
| 1 Day | +$380 | +0.029% |
| 7 Days | +$217 | +0.017% |
| 30 Days | -$2,518 | -0.194% |
| 3 Months | -$4,793 | -0.369% |
| 6 Months | +$19.0k | +1.49% |
| 1 Year | -$65.0k | -4.78% |
| 3 Years | +$218k | +20.3% |
| 5 Years | +$342k | +36.0% |
| 10 Years | +$617k | +91.1% |
List My Property
Real Estate Statistics
Financing Solutions
AS SEEN ON


Are You a Licensed Real Estate Agent or Broker?