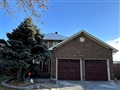
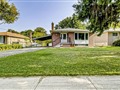
21 Gilbank Dr
$1,585,775
Comparative Market Analysis
Jun 23, 2025
NOT AN ACTIVE LISTING
Historical Performance
| Period | $ Change | % Change |
| 1 Day | +$453 | +0.029% |
| 7 Days | +$315 | +0.020% |
| 30 Days | -$2,724 | -0.171% |
| 3 Months | -$4,519 | -0.284% |
| 6 Months | +$26.1k | +1.68% |
| 1 Year | -$73.6k | -4.43% |
| 3 Years | +$296k | +22.9% |
| 5 Years | +$482k | +43.7% |
| 10 Years | +$964k | +155% |
List My Property
Real Estate Statistics
Financing Solutions
Browsing History
118 Heathwood Heights Dr, Aurora
11 seconds ago
58 Haida Dr, Aurora
16 seconds ago
3 Glass Dr, Aurora
21 seconds ago
108 Deerglen Terr, Aurora
26 seconds ago
73 Usherwood St, Aurora
31 seconds ago
102 Henderson Dr, Aurora
36 seconds ago
89 Willis Dr, Aurora
41 seconds ago
41 Glass Dr, Aurora
45 seconds ago
AS SEEN ON


Are You a Licensed Real Estate Agent or Broker?