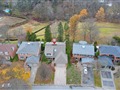
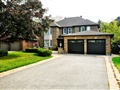
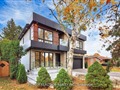
112 Glass Dr
$1,293,803
Comparative Market Analysis
Jun 24, 2025
NOT AN ACTIVE LISTING
Historical Performance
| Period | $ Change | % Change |
| 1 Day | +$373 | +0.029% |
| 7 Days | +$290 | +0.022% |
| 30 Days | -$2,087 | -0.161% |
| 3 Months | -$3,247 | -0.250% |
| 6 Months | +$22.3k | +1.76% |
| 1 Year | -$57.1k | -4.23% |
| 3 Years | +$239k | +22.7% |
| 5 Years | +$378k | +41.3% |
| 10 Years | +$736k | +132% |
List My Property
Real Estate Statistics
Financing Solutions
Browsing History
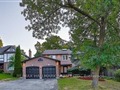
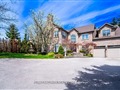
60 Gilbank Dr, Aurora
6 seconds ago
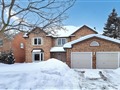
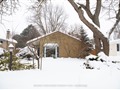
52 Gilbank Dr, Aurora
11 seconds ago
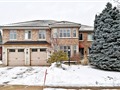
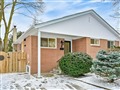
138 Bonny Meadows Dr, Aurora
16 seconds ago
25 Milgate Pl, Aurora
20 seconds ago
AS SEEN ON

Are You a Licensed Real Estate Agent or Broker?