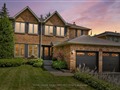
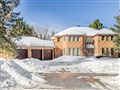
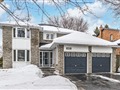
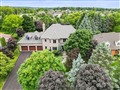
11 Lanewood Dr
$1,616,558
Comparative Market Analysis
Jun 6, 2025
NOT AN ACTIVE LISTING
Historical Performance
| Period | $ Change | % Change |
| 1 Day | +$422 | +0.026% |
| 7 Days | +$48 | +0.003% |
| 30 Days | -$3,725 | -0.230% |
| 3 Months | -$6,993 | -0.431% |
| 6 Months | +$22.4k | +1.41% |
| 1 Year | -$85.4k | -5.02% |
| 3 Years | +$229k | +16.5% |
| 5 Years | +$389k | +31.7% |
| 10 Years | +$872k | +117% |
List My Property
Real Estate Statistics
Financing Solutions
Browsing History
175 William Graham Drive Dr, Aurora
1 second ago
27 Bolsby Crt, Aurora
1 second ago
14 Black Crt, Aurora
1 second ago
58 Turnbridge Rd, Aurora
2 seconds ago
29 Holidge Blvd, Aurora
2 seconds ago
39 Parkland Crt, Aurora
2 seconds ago
32 Bolsby Crt, Aurora
3 seconds ago
3 Heatherfield Lane, Aurora
3 seconds ago
20 Lanewood Dr, Aurora
3 seconds ago
34 Turnbridge Rd, Aurora
3 seconds ago
AS SEEN ON


Are You a Licensed Real Estate Agent or Broker?